H1 : Big Header
H2: Secondary header
H3: small header/callout
p : regular body text
In Awe of Charlotte Methodology
Learn more about the tools and methods used to create Charlotte's story


The built environment shapes how we feel, yet we often overlook the emotional impact of our surroundings.
In Awe of Charlotte is a research initiative exploring the powerful connection between emotion, especially the feeling of awe, and the places we spend time. Studying people's emotions in the city can uncover opportunities to design spaces that not only have a function but a feeling—spaces that inspire joy, calm, and connection.
Our goal is to help Charlotteans thrive in an urban environment that supports emotional well-being, a sense of belonging and a notion that your city cares for you

We layer big datasets with people’s lived experiences and stories to depict how people feel cared for in Charlotte today
Sociodemographic data
Mobility trends
Amenity and asset data
Big Data
To understand high-level trends
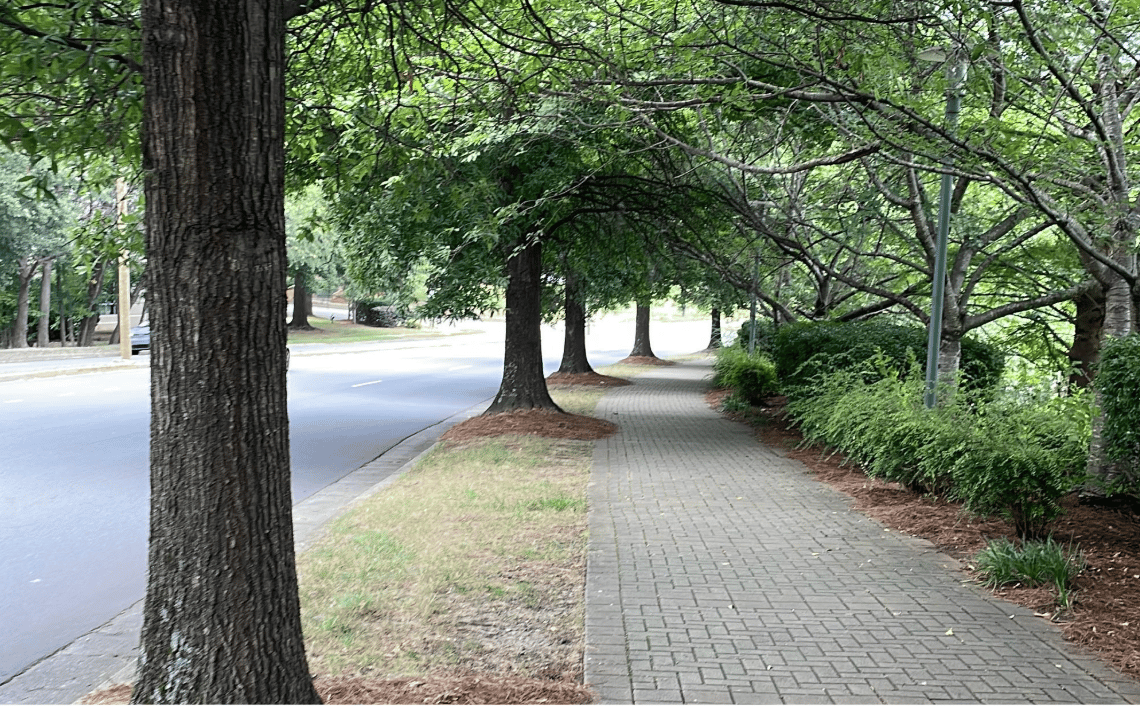
Sidewalk quality
Walking experience
Microclimate conditions
Facade quality
Neighborhood Context
To understand place-based conditions
Audio recordings, photos, postcards, vision boards, self-led definitions, and participatory maps
Recorded interviews
Photos
Postcards
Vision boards
Participatory maps
First-hand accounts
To understand people's lived experiences
Engaging youth citizen scientists
Eight local organizations across Charlotte supported the project by mobilizing 40 local 14-22 year-olds.
Before mobilizing the young citizen scientists, a set of guiding questions were established, designed to engage them in a meaningful and accessible way.

How do people get to enjoy nature in their neighborhoods?
What types of places allow for socializing in Charlotte and how?
How do specific aspects of the built environment influence how people feel in a place?
Documenting urban experiences
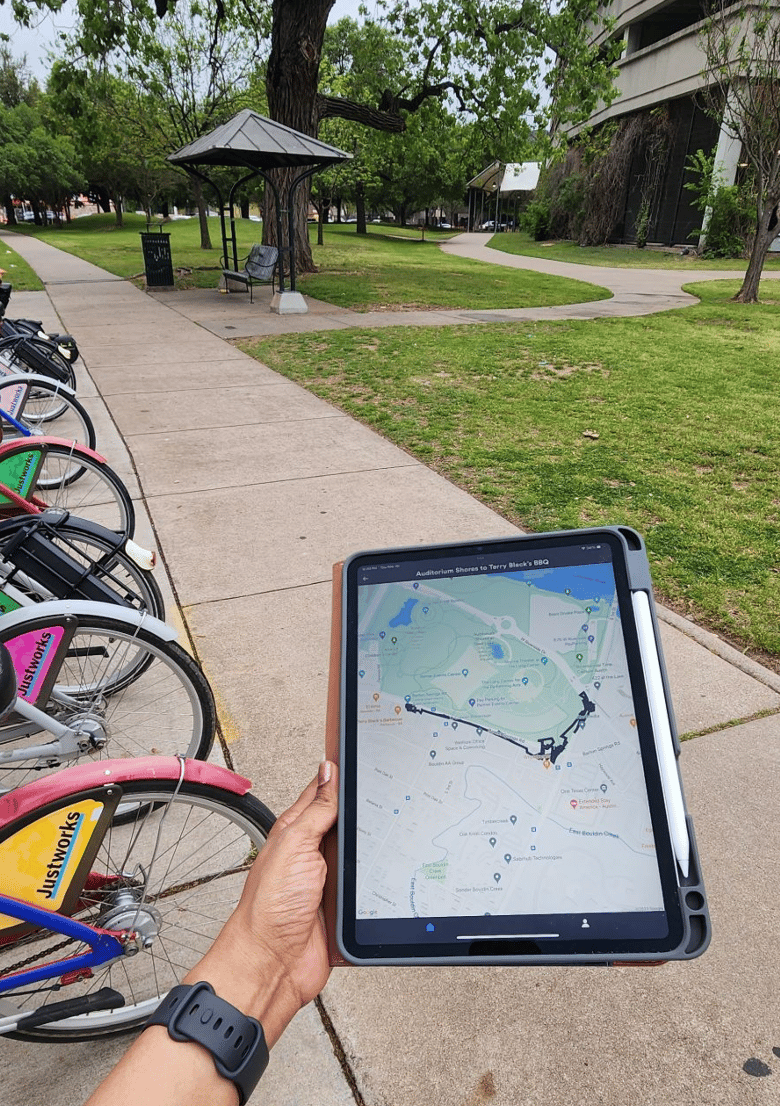
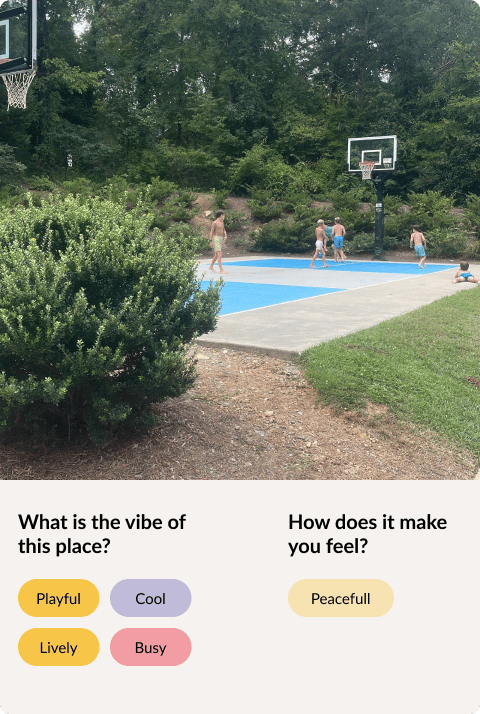
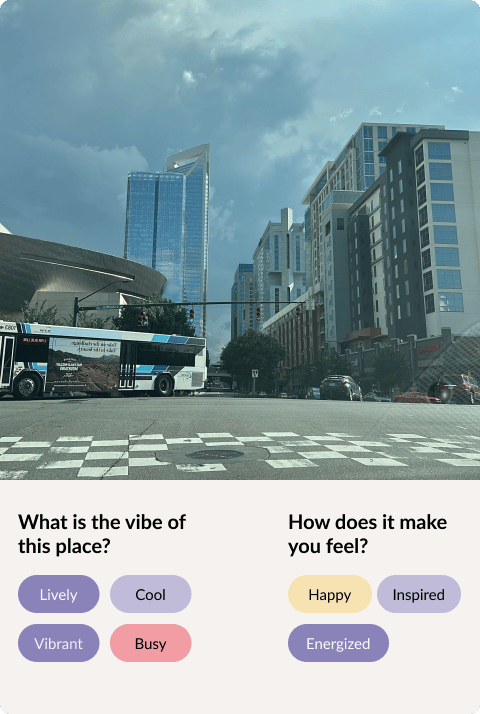
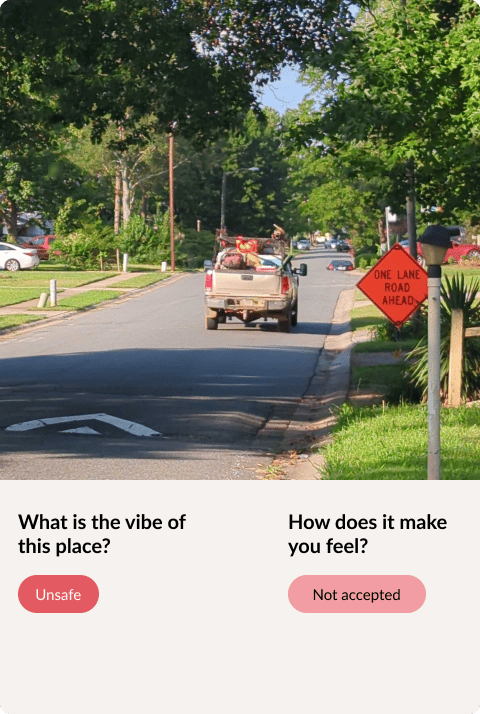
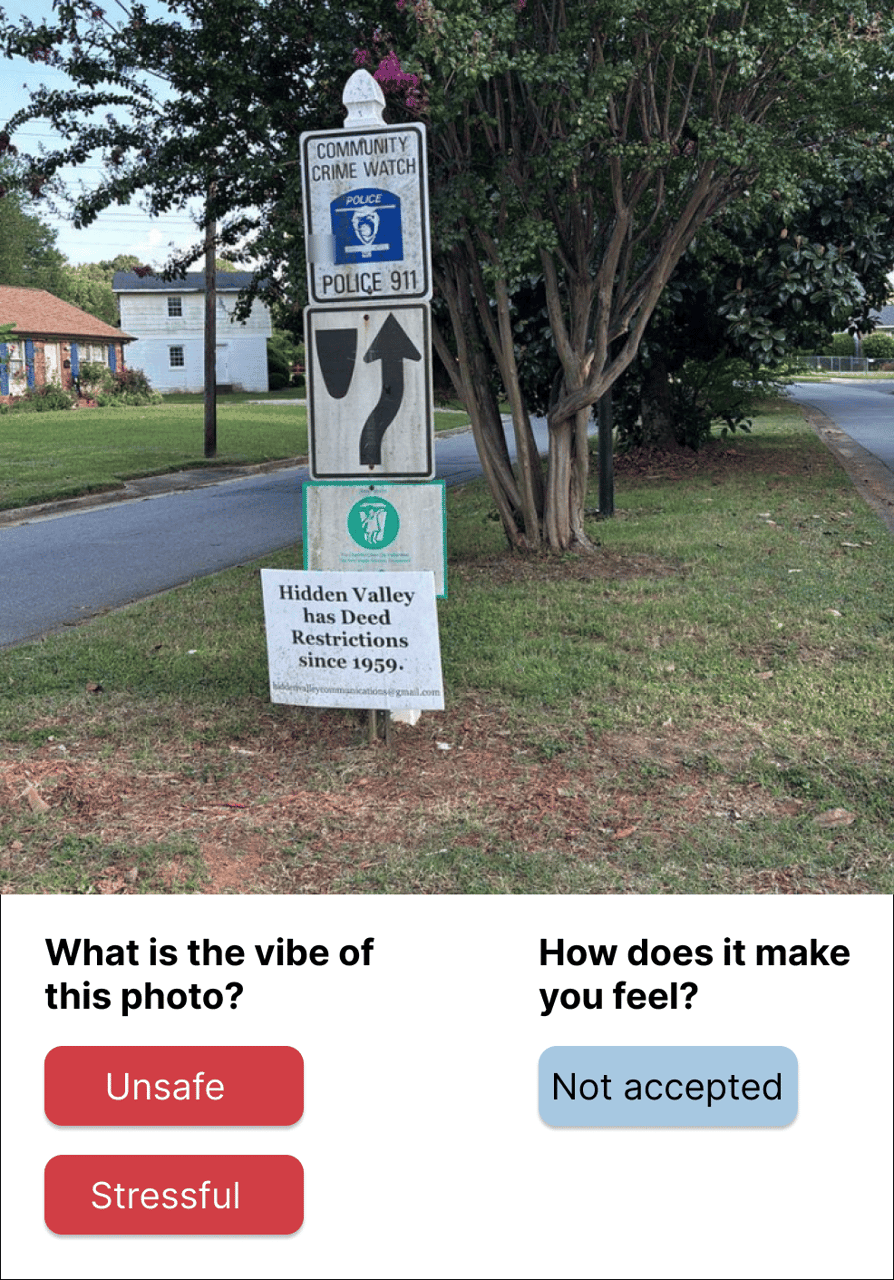
Youth citizen scientists documented their perceptions of Charlotte's neighborhoods through a range of observational and photographic methods.
The young participants received prompts to document locations throughout their neighborhoods by taking photos, categorizing the photos into experiences, and tagging them with the vibe and the feeling of the place.


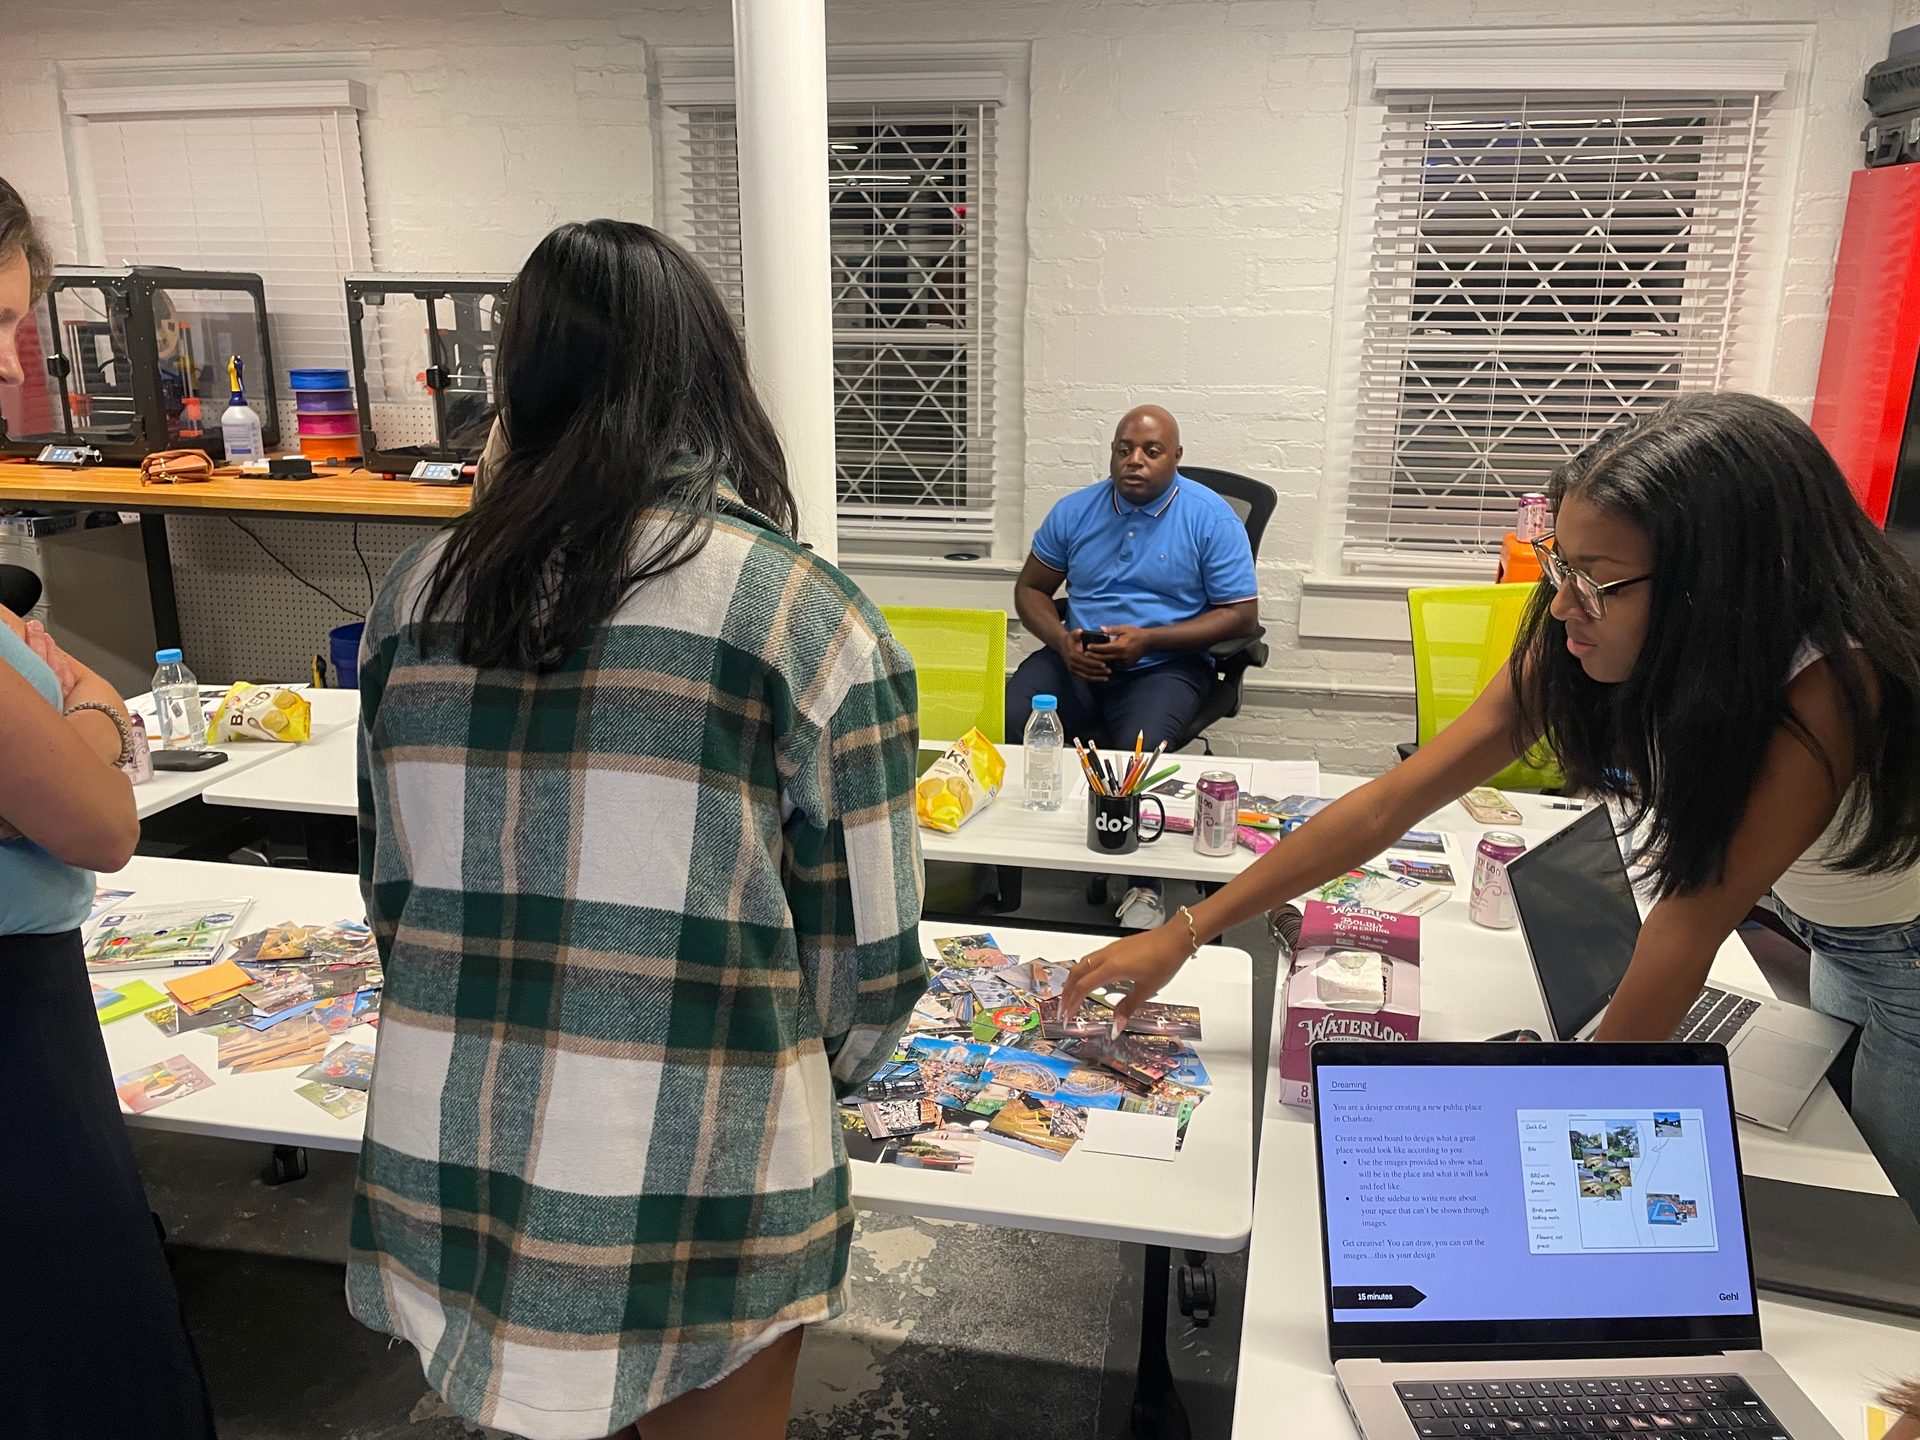


Generating insights through co-analysis
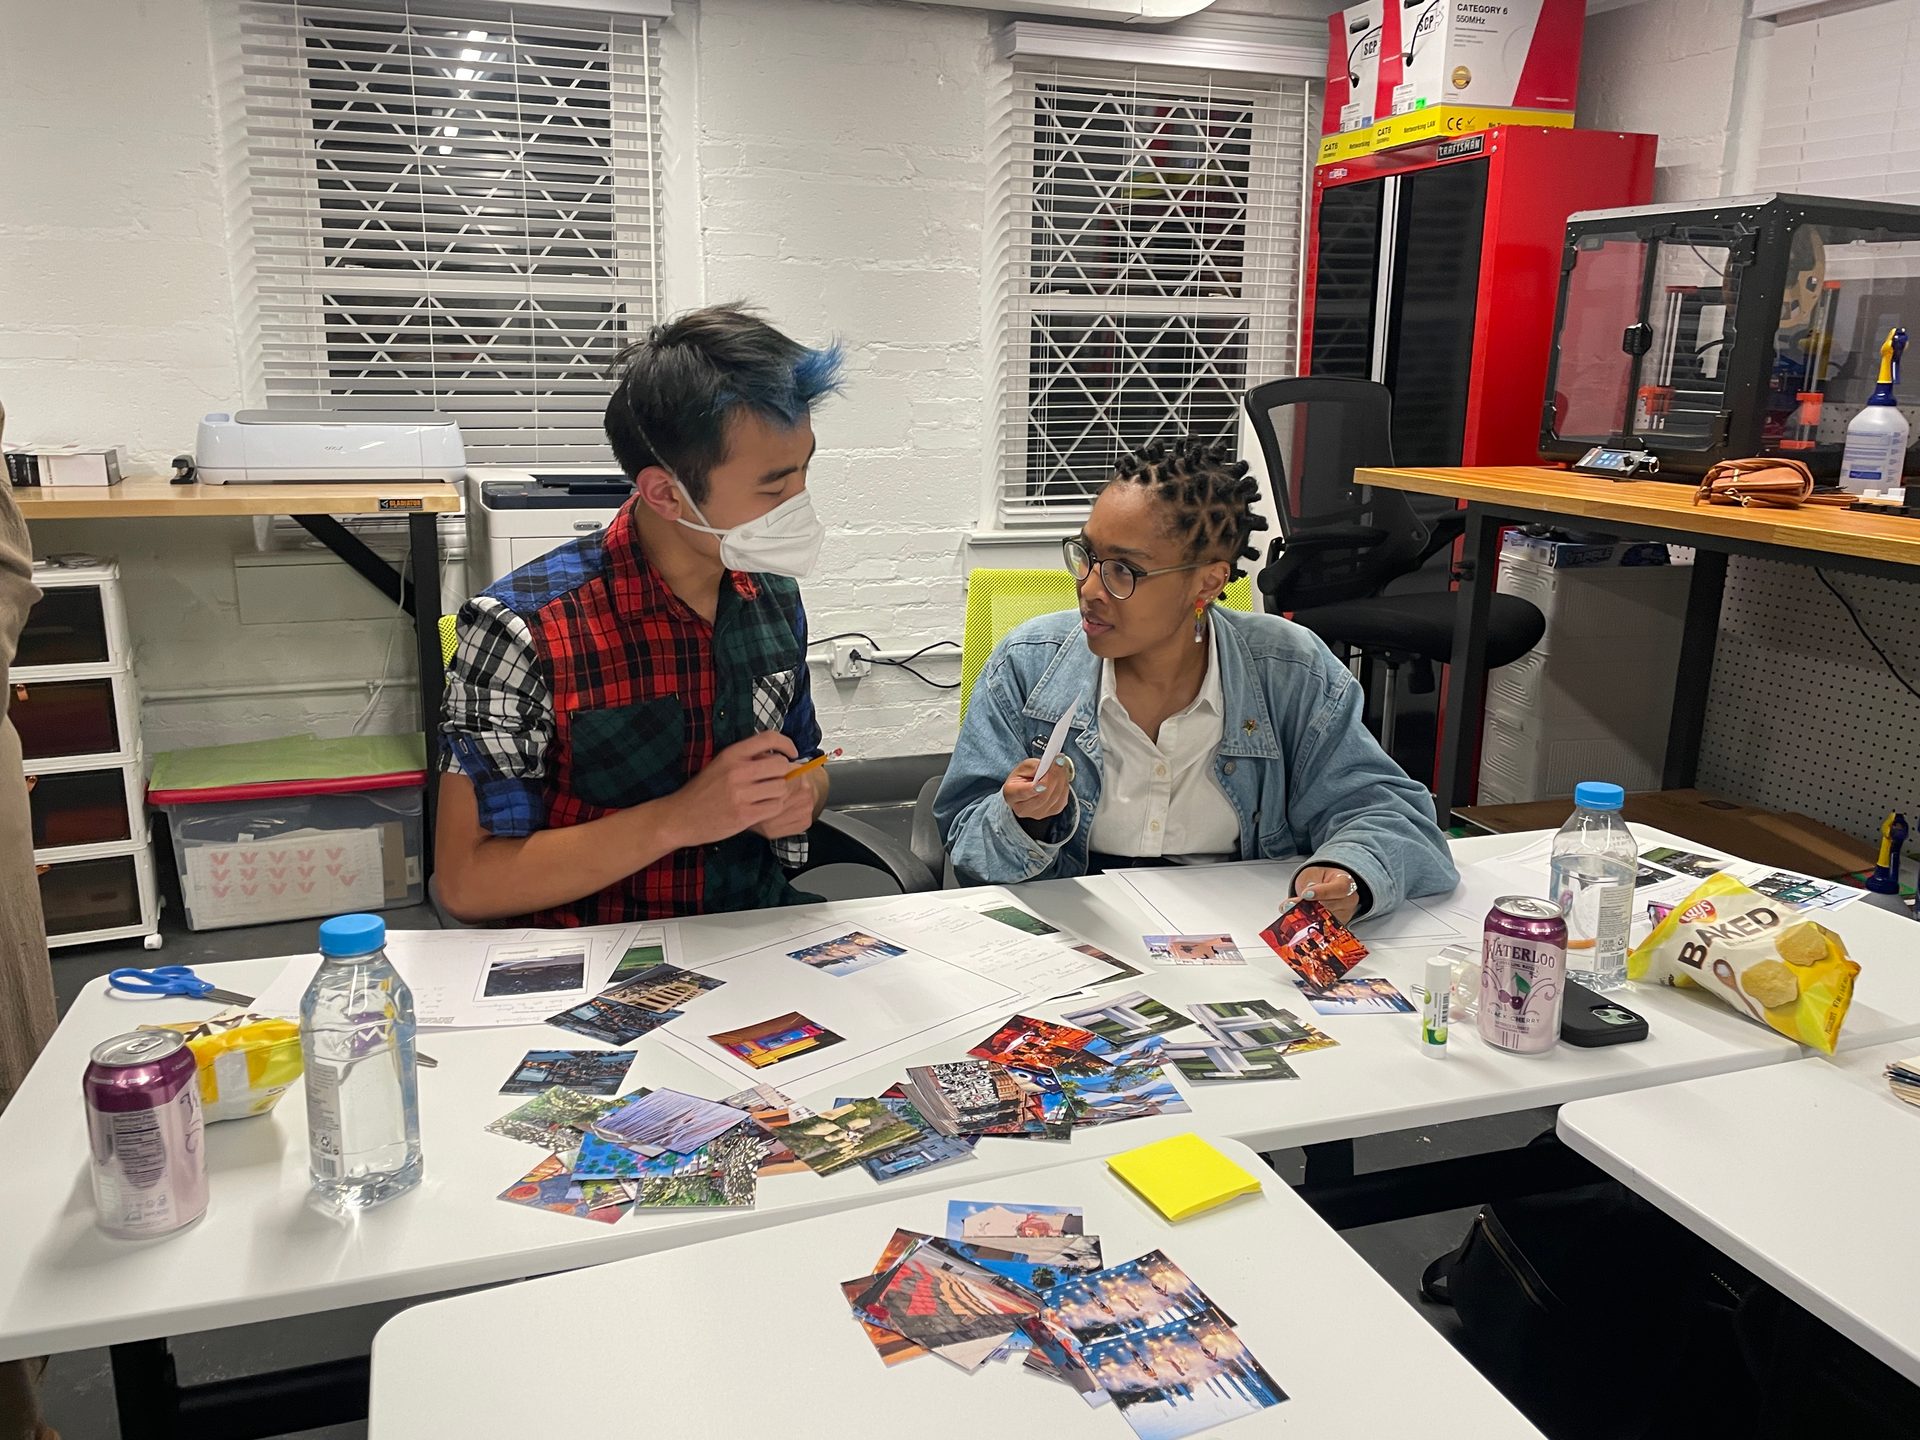
A series of co-analysis workshops in-person and online helped the citizen scientists to show the data they collected and tell stories about their experiences.
The workshops helped uncover the meaning behind the data. Learnings and personal anecdotes were distilled into collective trends that informed the creation of Charlotte's character and storyline.
This project is an exploration of emotion and place. By understanding the role of the built environment in affecting our emotional states, we can start to use it to contribute to positive emotions and improve the quality of our experiences, and ultimately improve the quality of our daily lives.
By layering big data with the stories of people’s lived experience, we explored the ways people feel cared for in Charlotte today
A cohort of youth citizen scientists documented their everyday perceptions of Charlotte's neighbourhoods to answer a set of research question designed to help them engage with the project by sharing their daily lives.
Before mobilizing a cohort of young citizen scientists, a set of guiding questions was established to help them engage with the project by sharing their daily lives and aspirations for the future.
Documenting local youth's urban experiences
We connected with eight local organizations to help mobilize 40 local 14-22 year olds — sharing prompts with the young participants to document their daily rhythms and emotions in their local communities by taking photos to document the places they went, categorizing the photo into what kind of experiences it was, and tag the photo with the vibe and the feeling of the place
Big Data
To understand high-level trends
Sociodemographic data, mobility trends, amenity and asset data
Neighborhood Context
To understand place-based conditions
Sidewalk quality and walking experience, microclimate conditions, facade quality
First-hand accounts
To understand people's lived experiences
Audio recordings, photos, postcards, vision boards, self-led definitions, and participatory maps

How do specific aspects of the built environment influence how people feel in a place?
How do people get to enjoy nature in their neighborhoods?
What types of places allow for socializing in Charlotte and how?
Co-analyzing data to generate insights
Together, we held a series of co-analysis workshops in-person and digitally to distill the citizen scientists’ learnings and tell meaningful stories based on their lived experience.
In addition to engaging young people, we spent time with local actors and change-makers in Charlotte
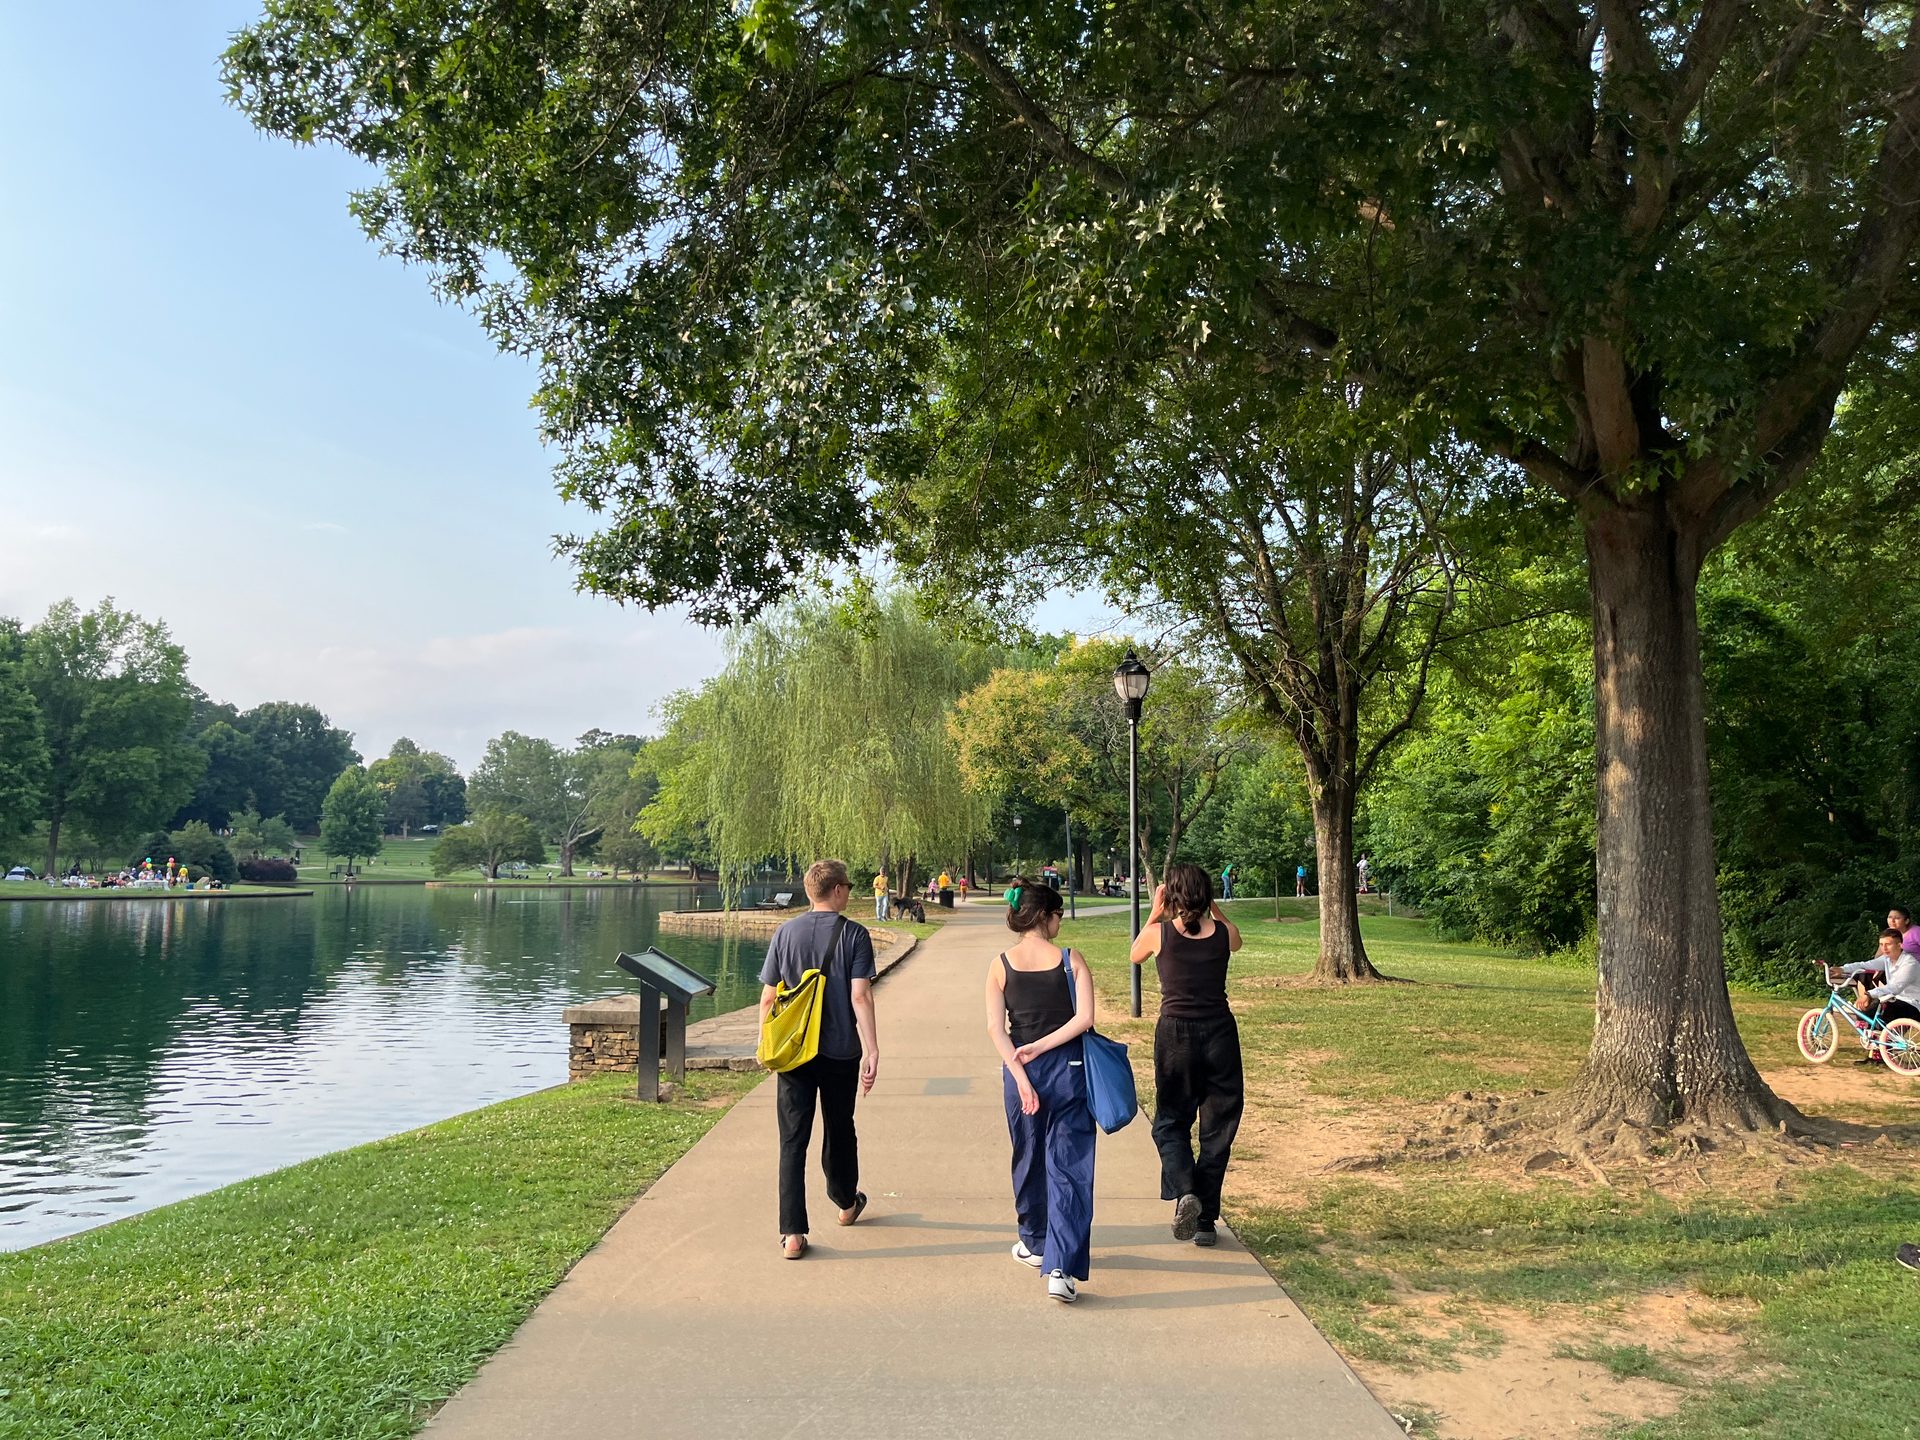
The Gehl team spent a week in Charlotte, meeting with local organizations who shape the city.
We participated in five walking tours in different neighborhoods, led by community organizations who shared their unique experiences, challenges, and aspirations. These walks offered insights into each neighborhood’s identity and revealed opportunities to foster thriving communities. We also met with the City of Charlotte’s Department of Planning, Design & Development, and UNC Charlotte Urban Institute to understand how this research may support ongoing and future initiatives.

We documented our findings, captured conversations, and used these moments to understand each community’s context better, sharpen our questions, and learn about the initiatives driving local change.
Neighborhood walking tours
The Gehl team spent a week in Charlotte, meeting with local organizations who shape the city.
We participated in five walking tours in different neighborhoods, led by community organizations who shared their unique experiences, challenges, and aspirations. These walks offered insights into each neighborhood’s identity and revealed opportunities to foster thriving communities. We also met with the City of Charlotte’s Department of Planning, Design & Development, and UNC Charlotte Urban Institute to understand how this research may support ongoing and future initiatives.
Neighborhood walking tours
We documented our findings, captured conversations, and used these moments to understand each community’s context better, sharpen our questions, and learn about the initiatives driving local change.
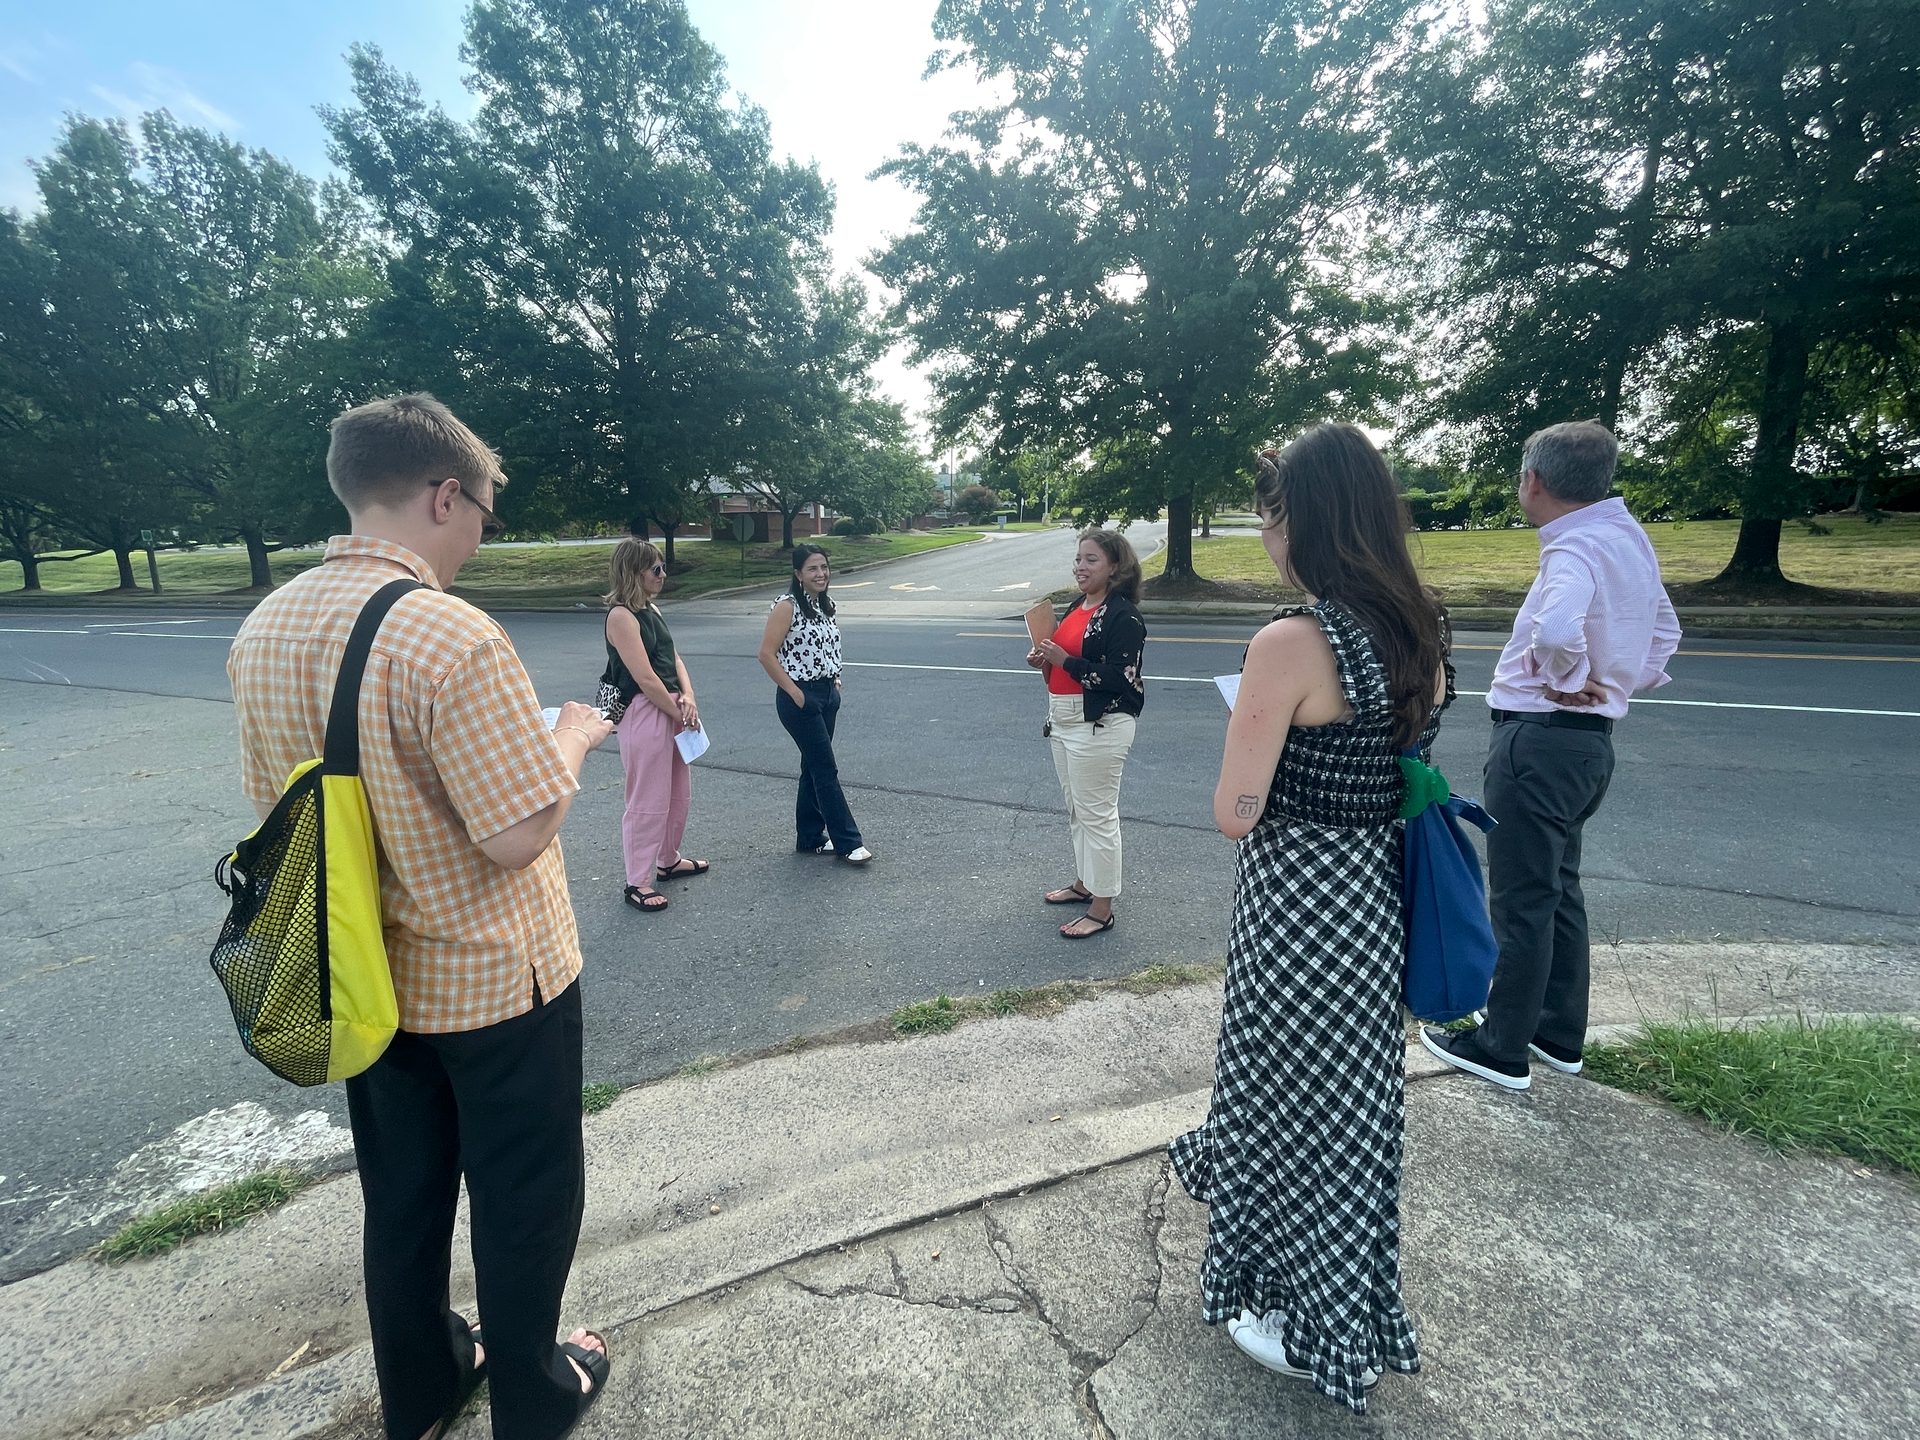
Gehl co-hosted an Awe and Hobbies Workshop in Charlotte with 42 community based organization leaders. They shared locations where the communities they represent find awe across the city helped us contextualize a future where the built environment can play a role in making everyday moments of awe accessible to all people.
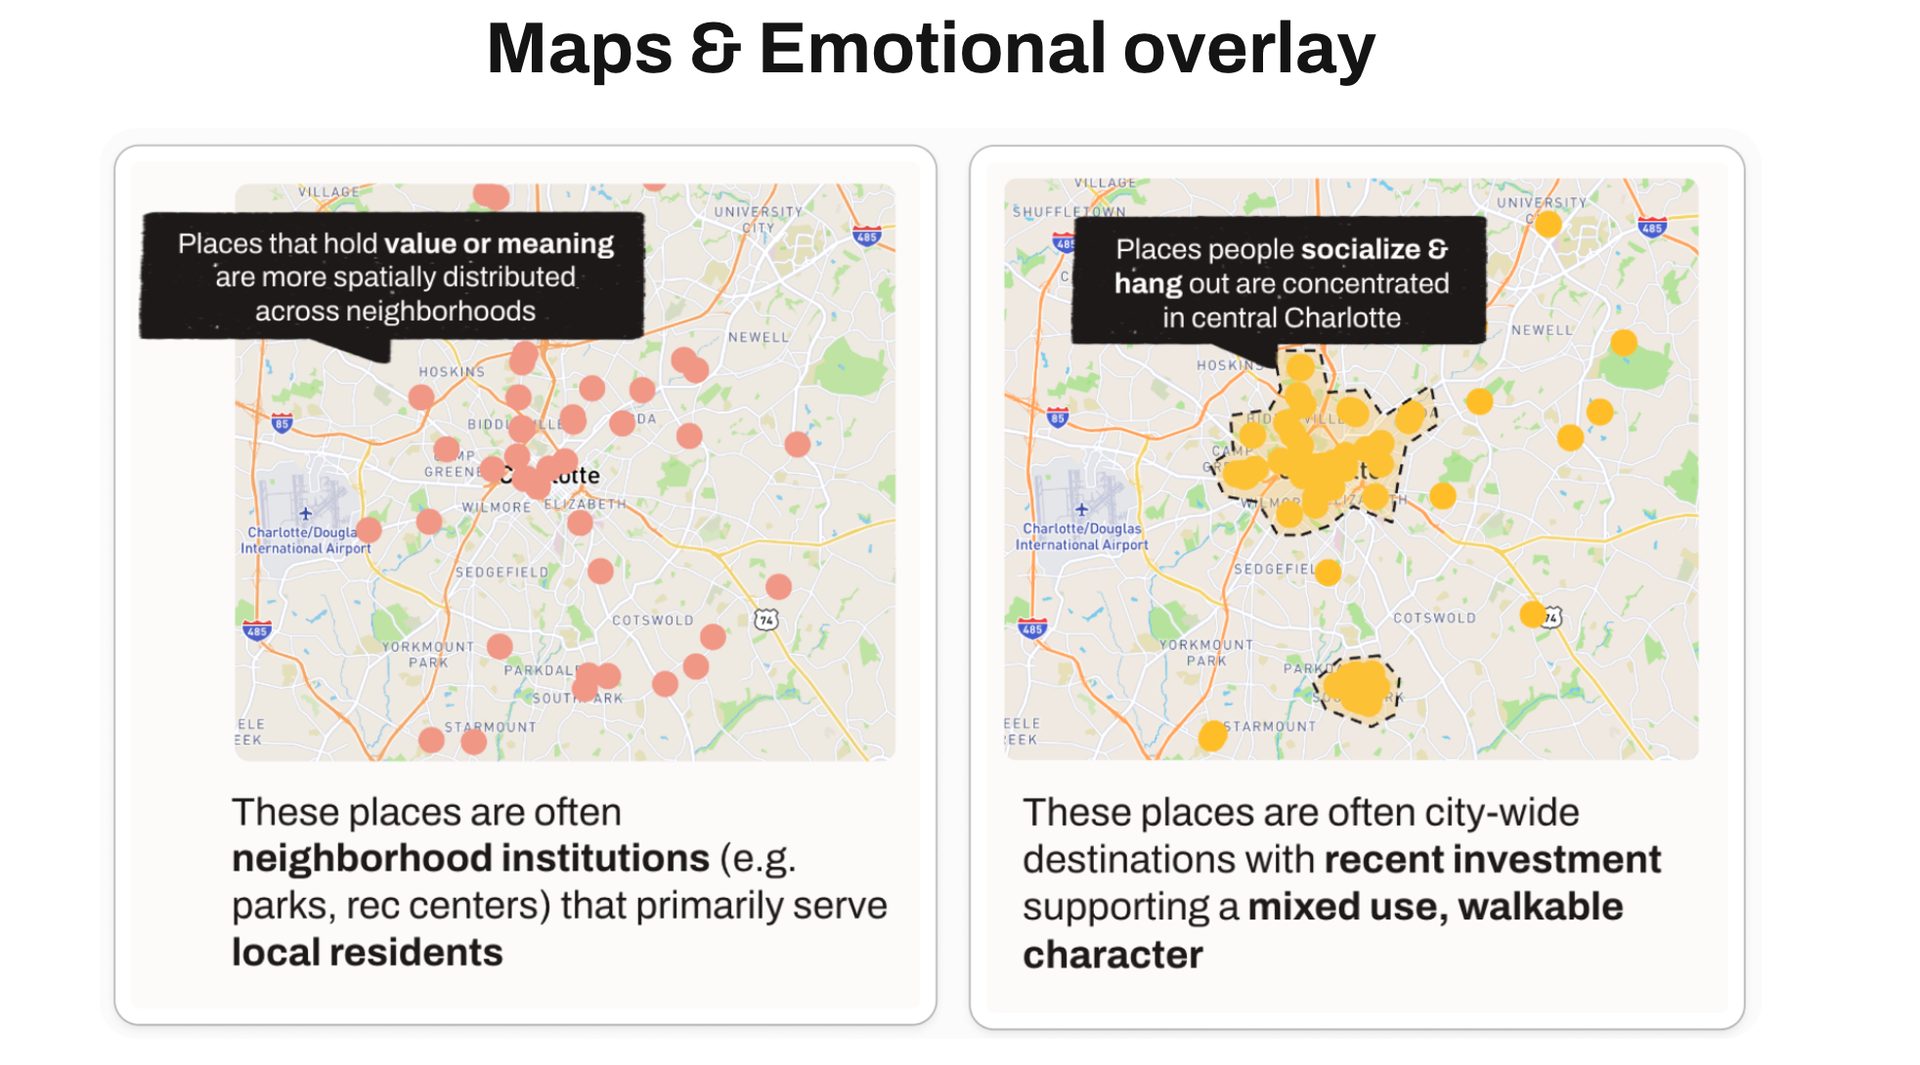
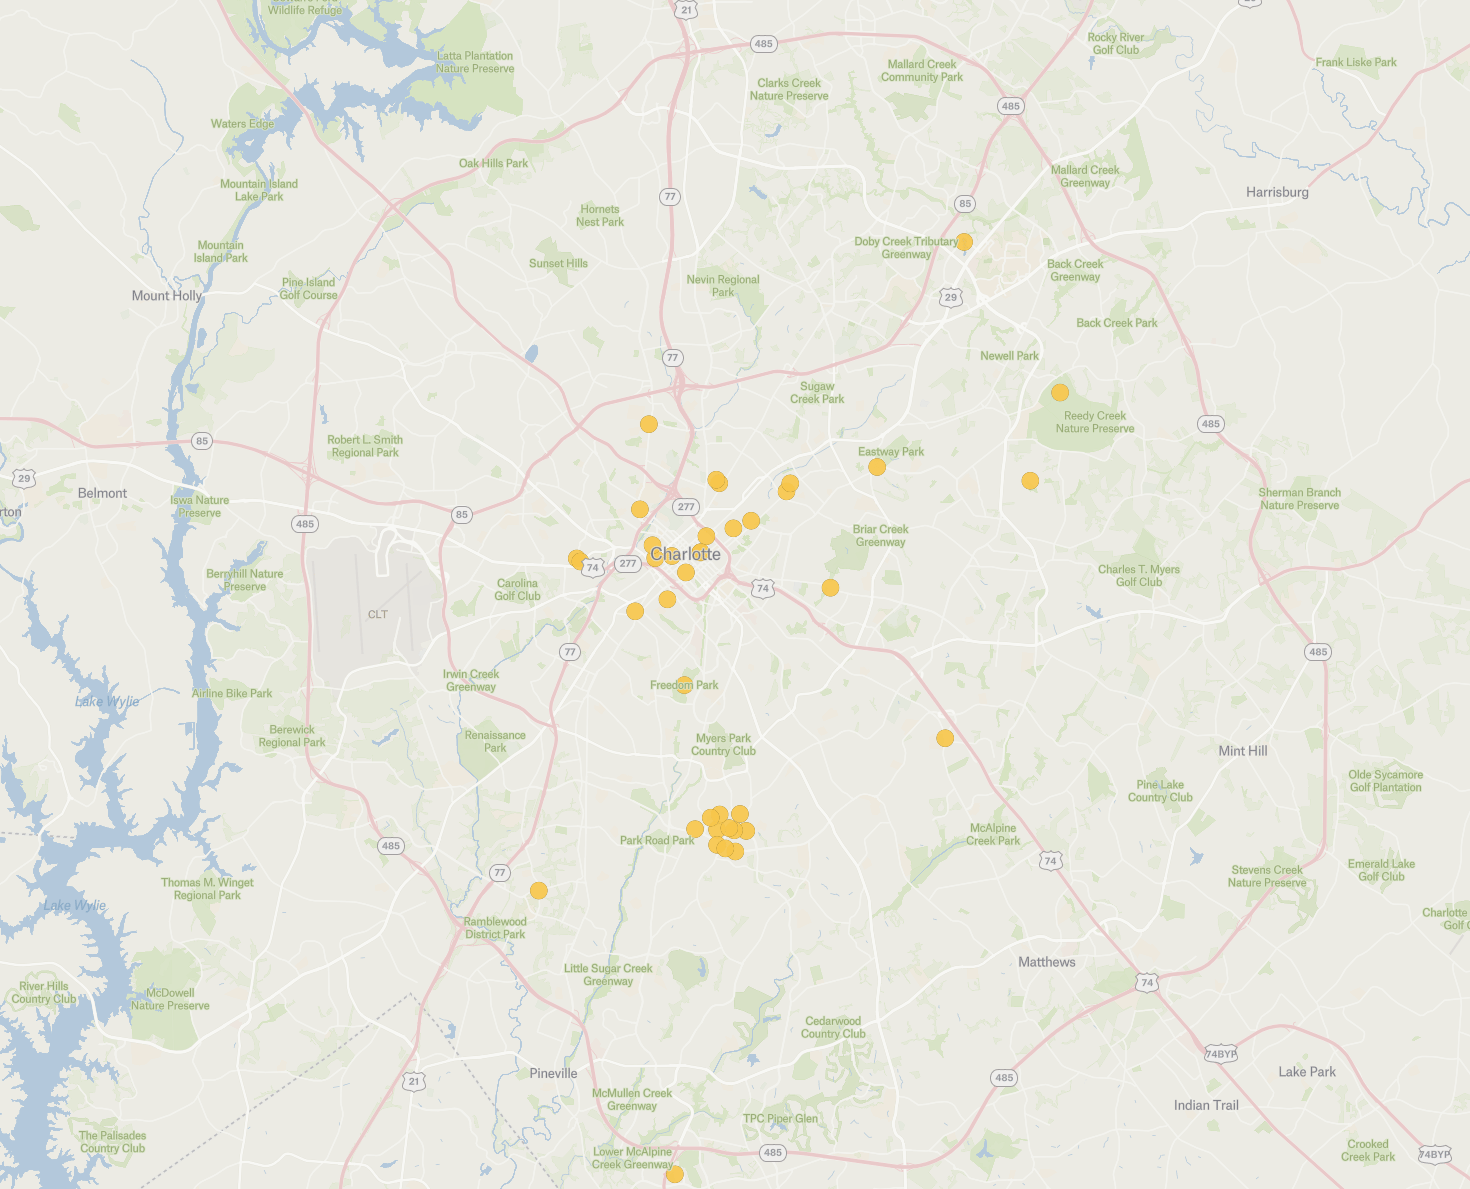
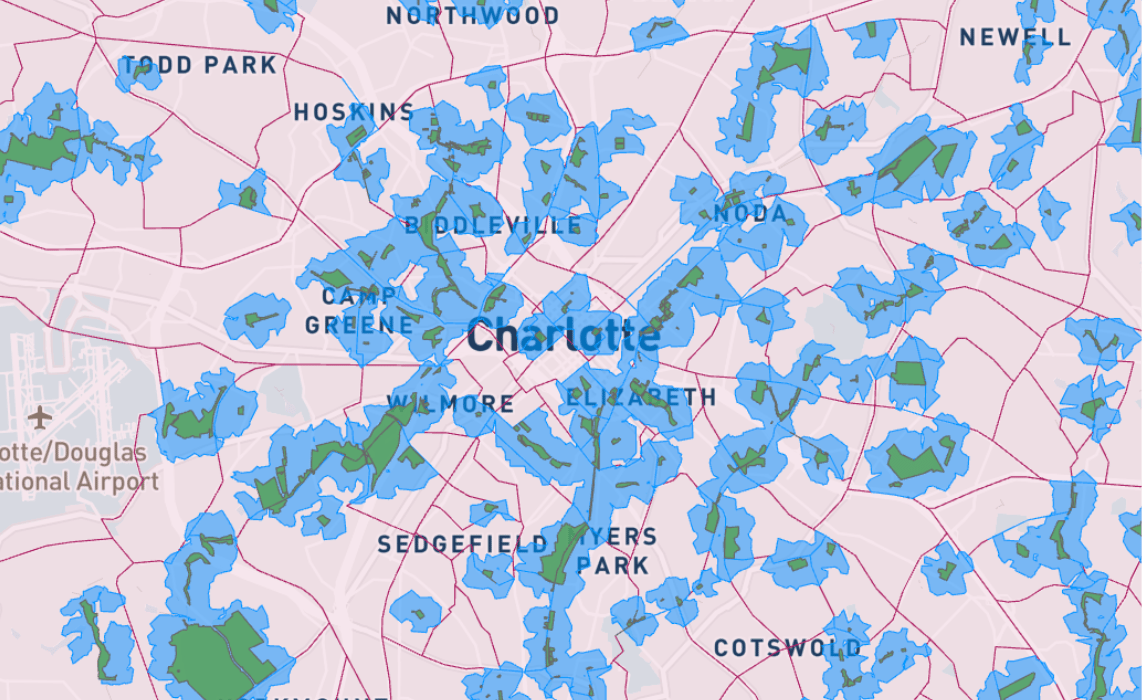
Places people socialize and hangout are concetrated in central Charlotte
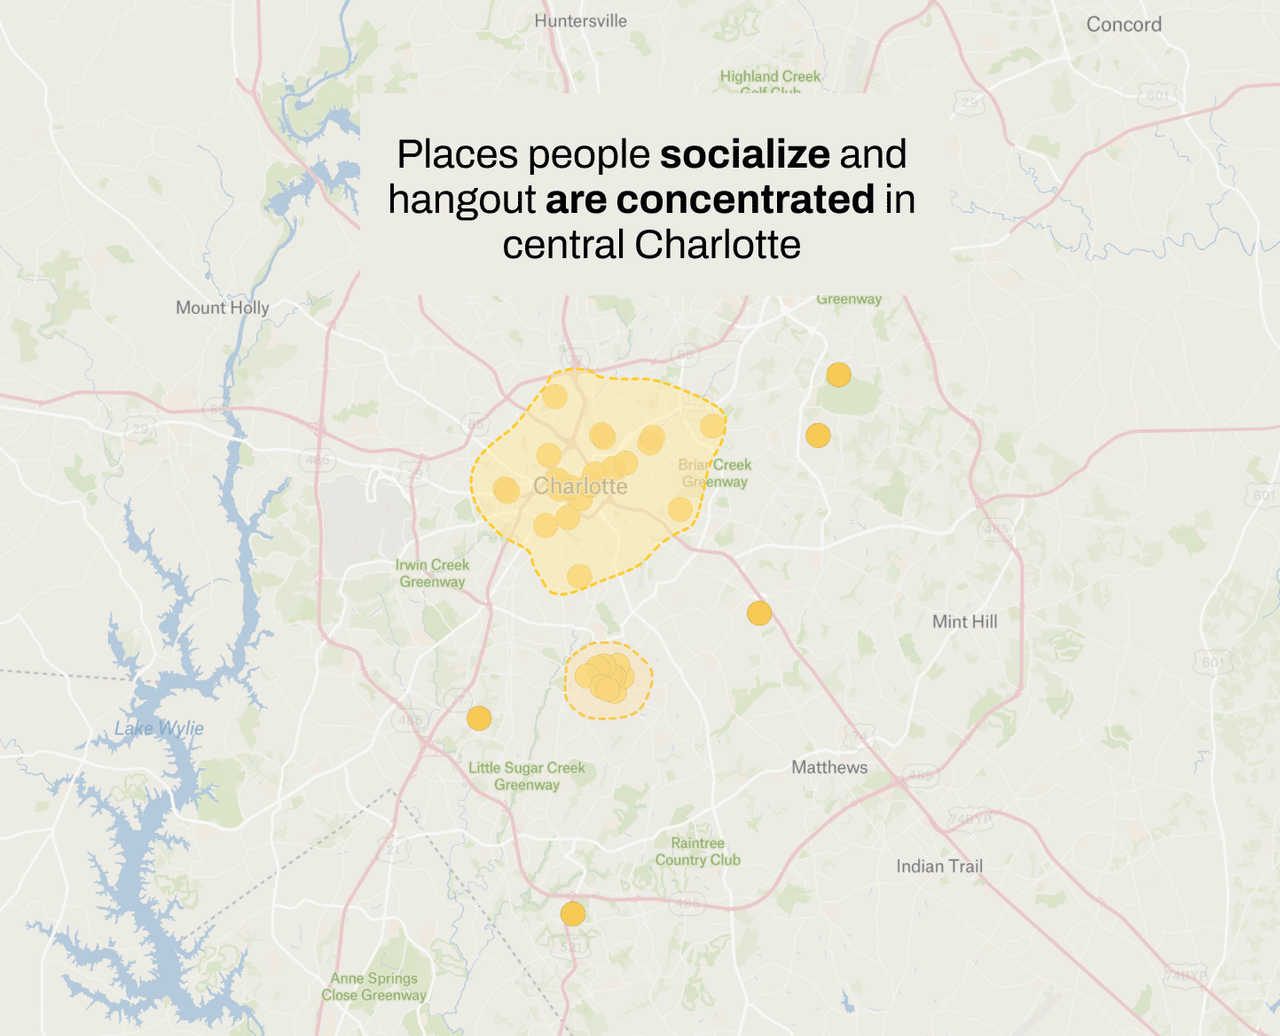
The team created a map of Charlotte’s valued places, guided by workshop attendees who highlighted locations meaningful to their communities. This exercise revealed neighborhood identities, aspirations, and priorities—from access to nature to diverse mobility options.
Learning from local-change makers
Gehl co-hosted an Awe and Hobbies Workshop in Charlotte with 42 community based organization leaders. They shared locations where the communities they represent find awe across the city helped us contextualize a future where the built environment can play a role in making everyday moments of awe accessible to all people.
Places people socialize and hangout are concetrated in central Charlotte
Learning from local-change makers
Places people socialize and hangout are concetrated in central Charlotte
The team created a map of Charlotte’s valued places, guided by workshop attendees who highlighted locations meaningful to their communities. This exercise revealed neighborhood identities, aspirations, and priorities—from access to nature to diverse mobility options.
The Gehl team held focus groups with LISC, the City of Charlotte’s Department of Planning, Design & Development, and UNC Charlotte Urban Institute to understand how this research project may support ongoing and future initiatives.
The team gathered feedback on the research approach and built awareness with local institutions and organizations for this research project for future collaboration. |
Places people socialize and hangout are concetrated in central Charlotte
Focus groups with local organizations
Using data processing to translate complex data into actionable insights
A range of methods supported the effort to make sense of a complex set of data including photos, annotations, voice recordings, text, and maps.
We gathered data from the City of Charlotte, US Census Bureau, Google Places API and UNC Charlotte to identify patterns using spatial and unsupervised machine learning clustering.
We identified trends in how people feel by processing workshop recordings using Hume AI to analyze sentiments across 53 different emotions.
We analyzed over 1,000 photos through correlation matrices using tags, ranked lists, and other visualisation techniques to find general patterns in how people view the built environment and specific elements. Leveraging the ChatGPT API we classified images based on their content to find patterns in the built environment's elements and how people annotated them.
We heavily relied on analogue analysis, using thematic sorting and cross-referencing sources to frame our understanding and retain the complexity of people's lived experiences.
Youth perspectives are almost always assumed and they are rarely asked to share their experiences, opinions, and expertise
This research project could not have happened without the real voices of Charlotte’s youth
Yet, they are among the most frequent users of civic spaces like parks, recreation centers, and libraries. Their dependence on caregivers and institutions shapes their mobility patterns and gives them a unique perspective on the city.
Partnering with young people brought fresh perspectives to our understanding of Charlotte. Their creativity and digital fluency inspired us to explore new participatory methods, seamlessly blending technology into the project. Their insights were both powerful and illuminating.
Youth perspectives are almost always assumed and youth themselves are rarely engaged to share their experiences, opinions, and expertise.
Partnering with young people gave us a unique insight into Charlotte. Their digital fluency and creativity allowed us to experiment with new participatory methods, seamlessly integrating technology into the project. Their insights were salient and powerful.
Yet, they are among the most frequent users of civic spaces like parks, recreation centers, and libraries. Their dependence on caregivers and institutions shapes their mobility patterns gives them a unique perspective on the city.
Thank you to all the young people who took their time to show us their experiences and trusted us with their data, and their stories

Makayla - 20
Keleah -17
Ava - 21
Makayla - 20
Zachary - 17
Jones - 29
Bee - 16
Brent - 15
Keylee - 23
Maicy - 16
Ariana - 19
Imani - 17
Abel - 17
Alexis - 14
Sonia - 21
Young - 22
Allie - 17
Graham - 14
Danija - 17
Damayia - 17
Elle -14
Kacie - 17
Mizzelle - 23
Crystal - 15
Tynniah - 16
Anna - 22
Taylor - 18
Jeffrey - 19
Joey - 16
Christopher - 17
Marley - 14
Ikeyla - 17
Jesse - 17
Tanish - 19
Taylor - 19